


Herbert W. Franke – historic Text from the 1970s
Perception, Data Processing, Emotions
When I began to engage more and more with art in the 1950s, I was also concerned with the question of what significance art has in society. I looked for answers in philosophical books, in the chapters on aesthetics, but found that what I was hoping for, namely a scientifically coherent scheme of effects, was not to be found there. I was most interested in the statements of Gestalt psychologists. It was only when I came across the publications of Max Bense and Abraham Moles that I began to take a serious and critical look at the subject in the 1960s. Both had recognized the importance of ‘information’ for art theory, although it should be noted that this refers to something other than the commonly used term, but rather to the innovation transported by messages of all kinds. And strictly speaking, it is about their complexity, measured by the amount of description required for the shortest possible coding with 0.1 characters, in bits.
Every work of art stimulates perceptual processes in the observer, listener, or reader. A cohesive conceptualization of fine art, music, literature, and so on, requires that they share common characteristic properties. One such similarity lies in the fact that these products are all absorbed through perception. The rules that govern perception must also be valid for the consumption of art, and it would therefore make sense to research whether characteristic properties of art can be differentiated.
Two Flow Charts

Diagram 1: The scheme of conscious data processing
Naturally, one understands that the brain and sensory organs function on a physical basis, that perception itself is above all a product of data processing. This of course depends on the filtering of useful information from the multitude of incoming stimuli. This process can be broken down into many pieces, such as analysis, filtering, and decoding of included information, whereby the large data pool is dramatically reduced. A large part of this goes on to the subconscious center, in which reflexes are stimulated, such as control of body movements. Consciousness, which can be seen as the main memory, receives only a small part of the data, that because of special distinguishing features, such as ones innovative character, are recognized as especially important. Now begins the last and most complicated step of the analysis – the one to be consciously executed. Known strategies of thought are enlisted, especially with the help of previous knowledge. In this way – stimulated by association, contents from short-term and long-term memory are recalled.
Like every technical data processing system, the neural net is also subjected to finite physical restrictions, such as limited work speed that results from limited memory and the capacity of information flow. In the diagram are given the largest values of the human brain; these are values that come from psychological testing. A fundamental result is that a human can only consciously absorb around 16 bits per second, and that the apparent contents are not capable of displaying more than around 160 bits. On average, these values are calculated so that one can grasp the impression of the complexity of the environment. The complexity of the registered patterns can over burden the system; this shows that with the help of definite methods, such as those based on approximations or probabilities, useable results are often produced. When one sees the benefits of the goal of an overview of the situations, problems, etc. then the complexity of the situation can be reduced to 160 bits.
Occasionally a person comes up against an information source that offers a flow of information, in which the complexity is in perfect agreement with the abilities of the processing system. Such patterns or stimuli are seen to be pleasing. It is also possible to purposely conceptualize an information stream such that the described ideal preconditions correspond to the reception of information. Such information streams are seen as works of art.
Emotion between boredom and Irritating Chaos

Diagram 2: Control of cognitive behaviors through Emotion
People’s cognitively achievable actions are realized through emotion. There are, in consciousness, acute signals that are critical for survival. There are pleasing emotions that lead to the perpetuation of a situation, and other unpleasant emotions, that serve as an impetus for avoidance. The emotions dedicated to perceptive assimilation are as follows:
— Boredom, when fewer than ~16 bits/sec come into consciousness, they stir a search for a productive source of information;
—- Irritation, when more than ~16 bits/sec are received, then one attempts to comprehend through increased concentration, or, if one is unsuccessful, abandons the information source;
—- Interest, when one receives ~16 bits/sec – the situation is felt to be desirable.
This formula of action gives us an explanation of one’s emotional function when confronted with a work of art. So works of art – as defined above – are so structured as to evoke a successful perceptual response, awaken interest, and stimulate the appropriate emotions of perceptual behavior.
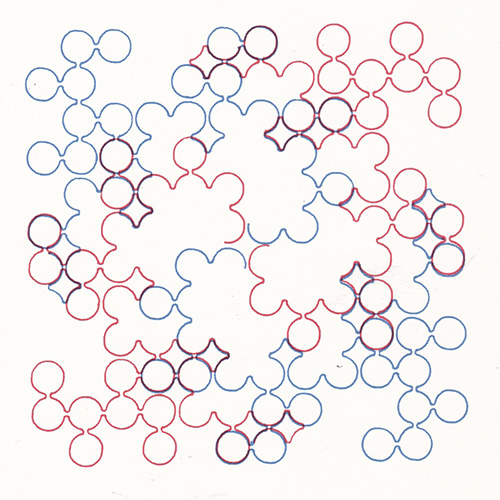
Exapmle 1: The processes described in this attempt at explanation differ considerably from what is normally presented in publications on art. On the other hand, they are so concrete that they can be tested by measurements. Series of experiments based on computer-graphic images are particularly suitable for this purpose. One example is the so-called dragon curves (series DRAKULA). These are sequences of lines that make turns to the right or left at regular intervals, and their information content is obtained by simply counting the turns, each of which takes up just one bit: right or left, which corresponds to the 0,1 scheme of bits.
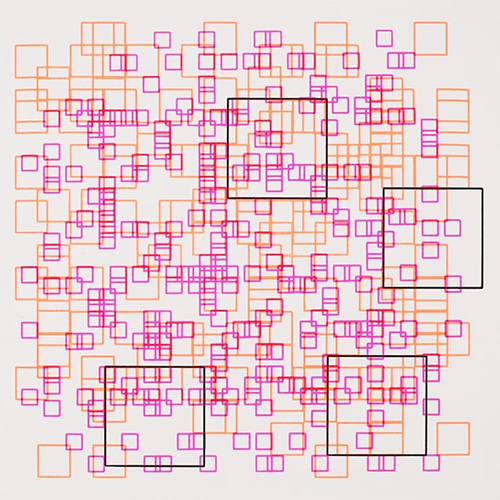
Example 2: The computer offers other methods to generate complexity, namely with the random generator contained in every common programming language; in my computer-generated image QUADRATE (Squares), such a random generator was used, and so it is easy to indicate how complex the three occurring distributions are: those of the red, yellow and orange circles.